Home-building franchise network — legacy desktop system rebuilt as cloud SaaS
G.J. Gardner — ERP Behind $1.7B of Homes a Year
A decades-old desktop system, and the spreadsheets around it, ran a network selling $1.7B of homes a year. Someone had to replace them without breaking it.
The challenge
A home-building franchise network selling $1.7B of homes a year ran on a desktop application written decades earlier, with spreadsheets filling the gaps. ~150 franchises across 5 countries — quotes, schedules and supplier orders living in a system nobody could reach from a building site. The obvious answer was to rebuild it in the cloud. The hard part was who would use it: franchise operators who build houses for a living, not software users. Many had run their office the same way for a decade and had no reason to trust a system that made their work more visible. Softeq took the rebuild as a fixed-price project with a sixteen-person team, and the client's Product Owner asked for me on the project by name. For three years I was the only designer on it, working alongside the business analysts — which meant every workflow decision, every screen and every argument about scope came through one person.
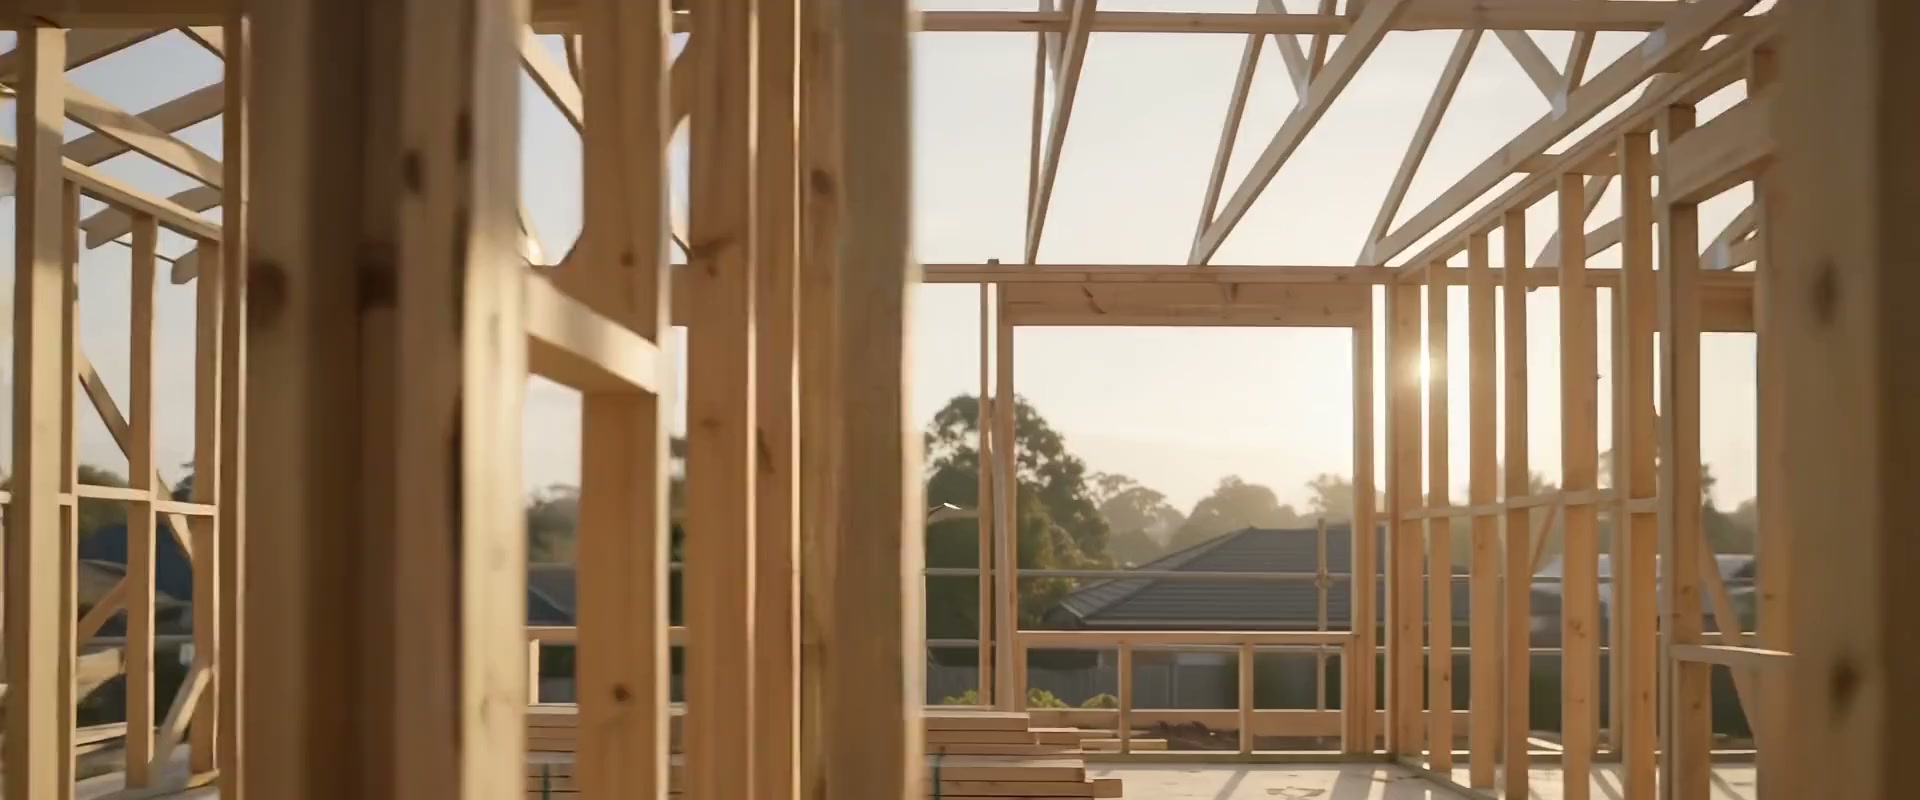
What the estimate turns into
Product imagery: G.J. Gardner Homes
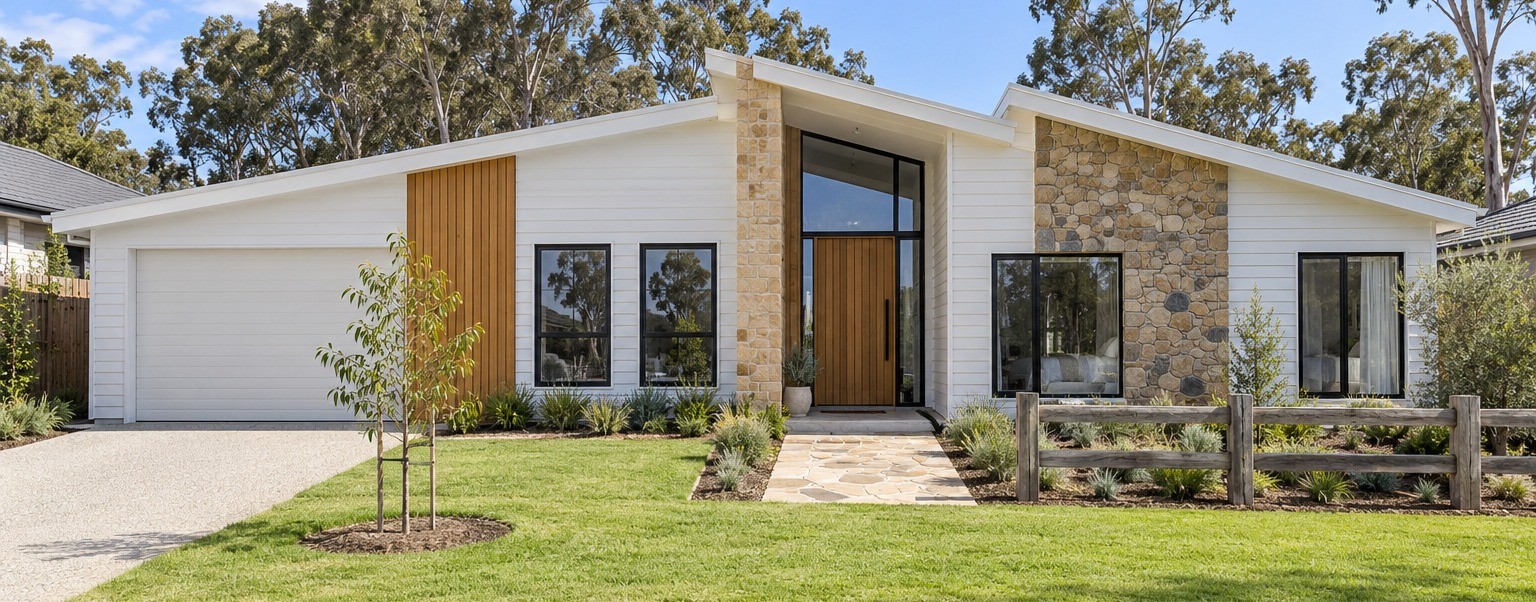
Every cost centre, every take-off parameter and every quantity formula exists to price one of these accurately, before anyone breaks ground.
What I did
1. Mapped the real workflows before designing anything. I worked through how a franchise office actually operates — where a quote begins, who signs off, what happens when a supplier is late. The business analysts held the process knowledge; my job was turning it into an information architecture that survived contact with ~150 offices that each did things slightly differently.
Fig. 01 — Information architecture
One ERP, three levels of governance
01 · Switch to →↓
Corporate view
Franchisor head office
Dashboard
Master Zones
Contacts
Email Campaign
Authorization Numbers
Application Event Log
Setup
Users · Office Permissions · Offices · Sandbox
02 · Switch to →↓
Master zone
Regional master franchise
Dashboard
Contacts
Email Campaign
Authorization Numbers
Application Event Log
Setup
Users Details · Offices · Sandbox · System Variables
03
Office view — the franchise’s daily work
Dashboard · To-do inbox · eight modules · three logs
Sales
Leads → quote → complete sale · budgets
Estimating
House Plans & Estimates · Price Books · Bulk Update · Job Estimate · Orders
Job Admin
Jobs · Job Orders · Job Change Orders · specifications
Schedules
Pre-Construction · Construction · Sales · Maintenance
Accounting
Invoices and payments · Xero sync
Manager
WIP – Profit Adjustment · Redo Job Estimate · office roles
Contacts
Customers · suppliers · subcontractors · employees
Setup
Per-module settings · Templates · System Variables
Outside the ERP — same data model
Customer Portal
Web + Android · welcome, build photos, e-documents, shared documents, finance
Supplier Portal
Web + Android · purchase orders, invoices, calendar, shared documents
Integrations
Xero · G Suite · EverSign · PayPal · MailChimp · BI Reports · Intranet
≈600 screens and states in the design archive · one designer. Estimating, highlighted, is the module shown below.
2. Separated what must be global from what can stay local. The network needed consistency for reporting and franchise-wide control, but every office had local practices worth keeping. I classified each workflow step as either a fixed constraint or a configurable parameter — the decision that made one system work across 5 countries without forcing everyone into an identical process.
3. Designed for people who don't use software all day. Dense construction data — schedules, variations, supplier orders, cost tracking — presented so a builder could act on it without a manual open next to the screen. Progressive disclosure over feature-complete screens. By the client's account, getting new staff and new franchises up to speed took about six months on the old system and under two on the new one.
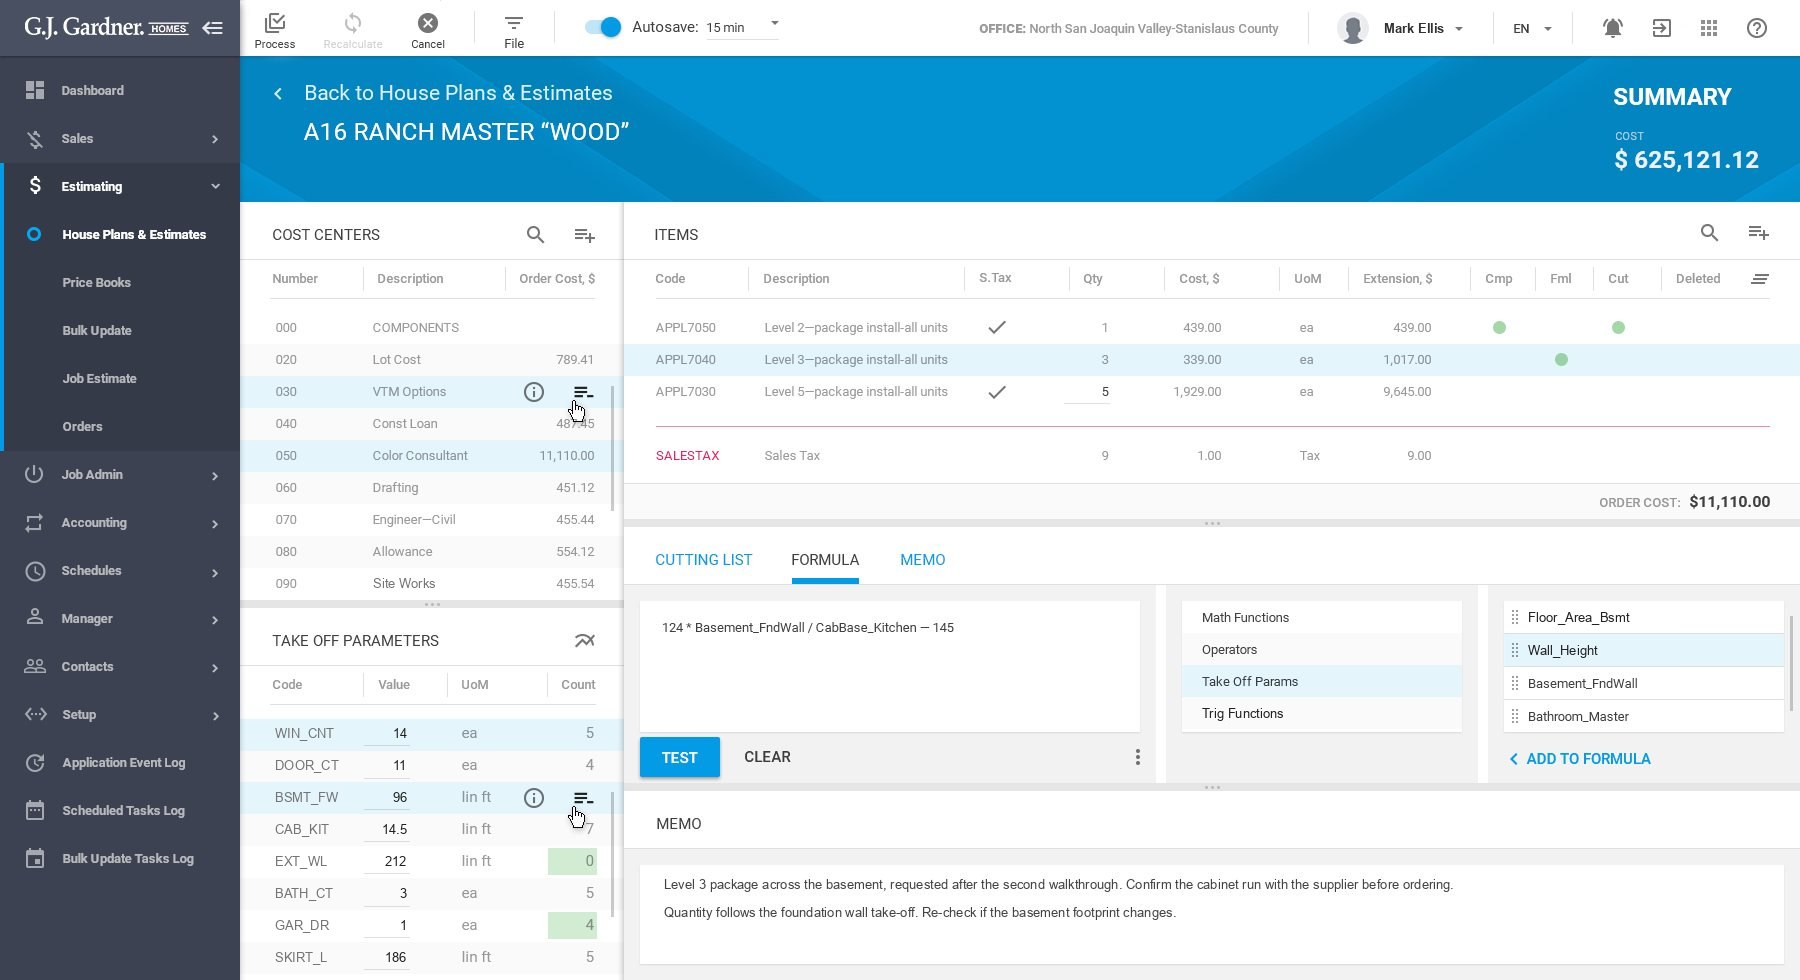
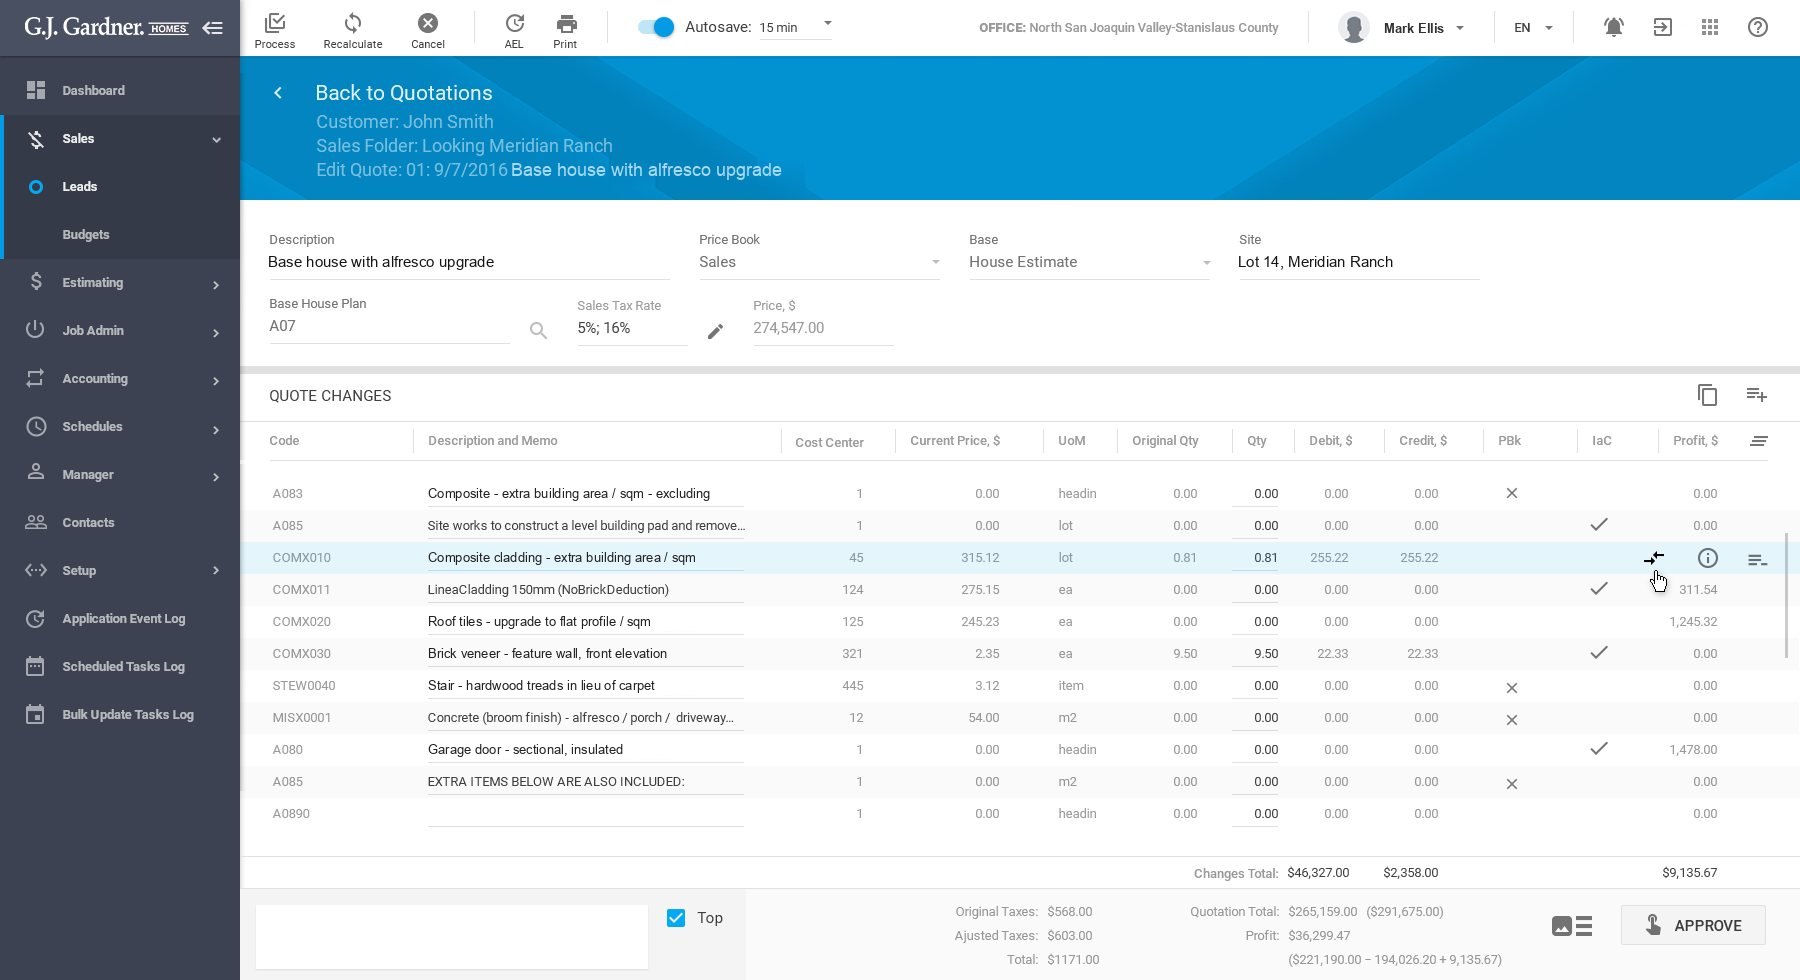
Fig. 02 — What shipped
Delivered design, selected screens
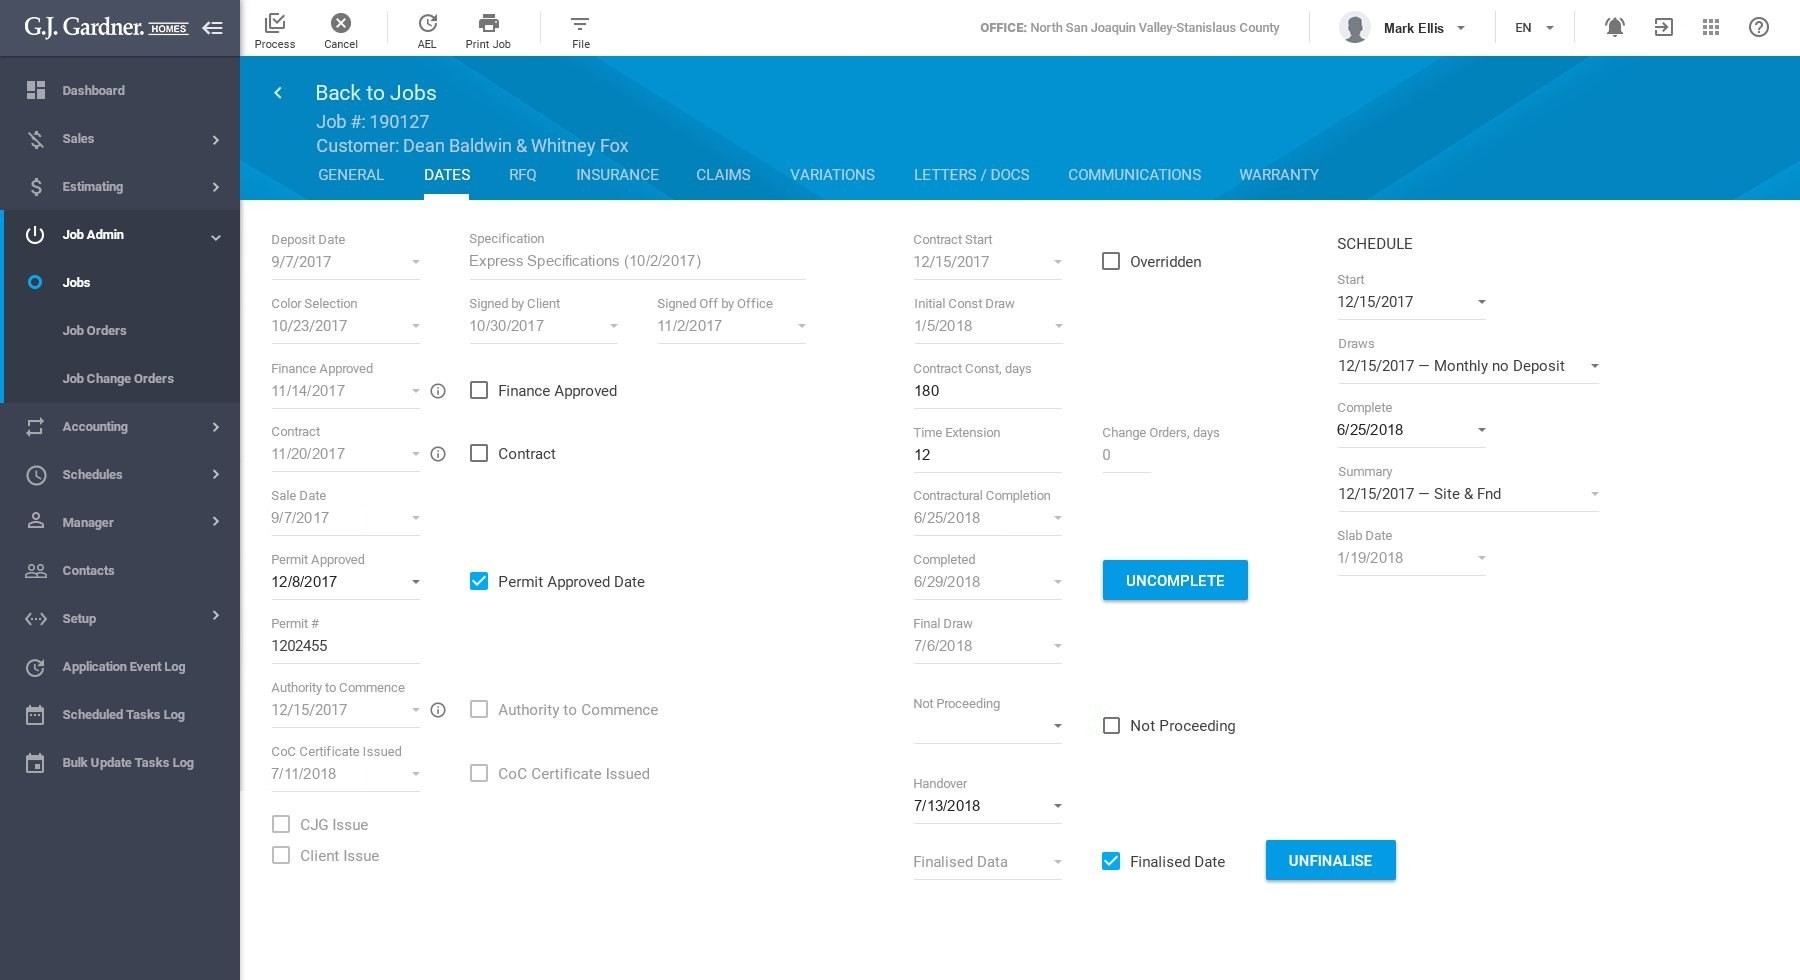
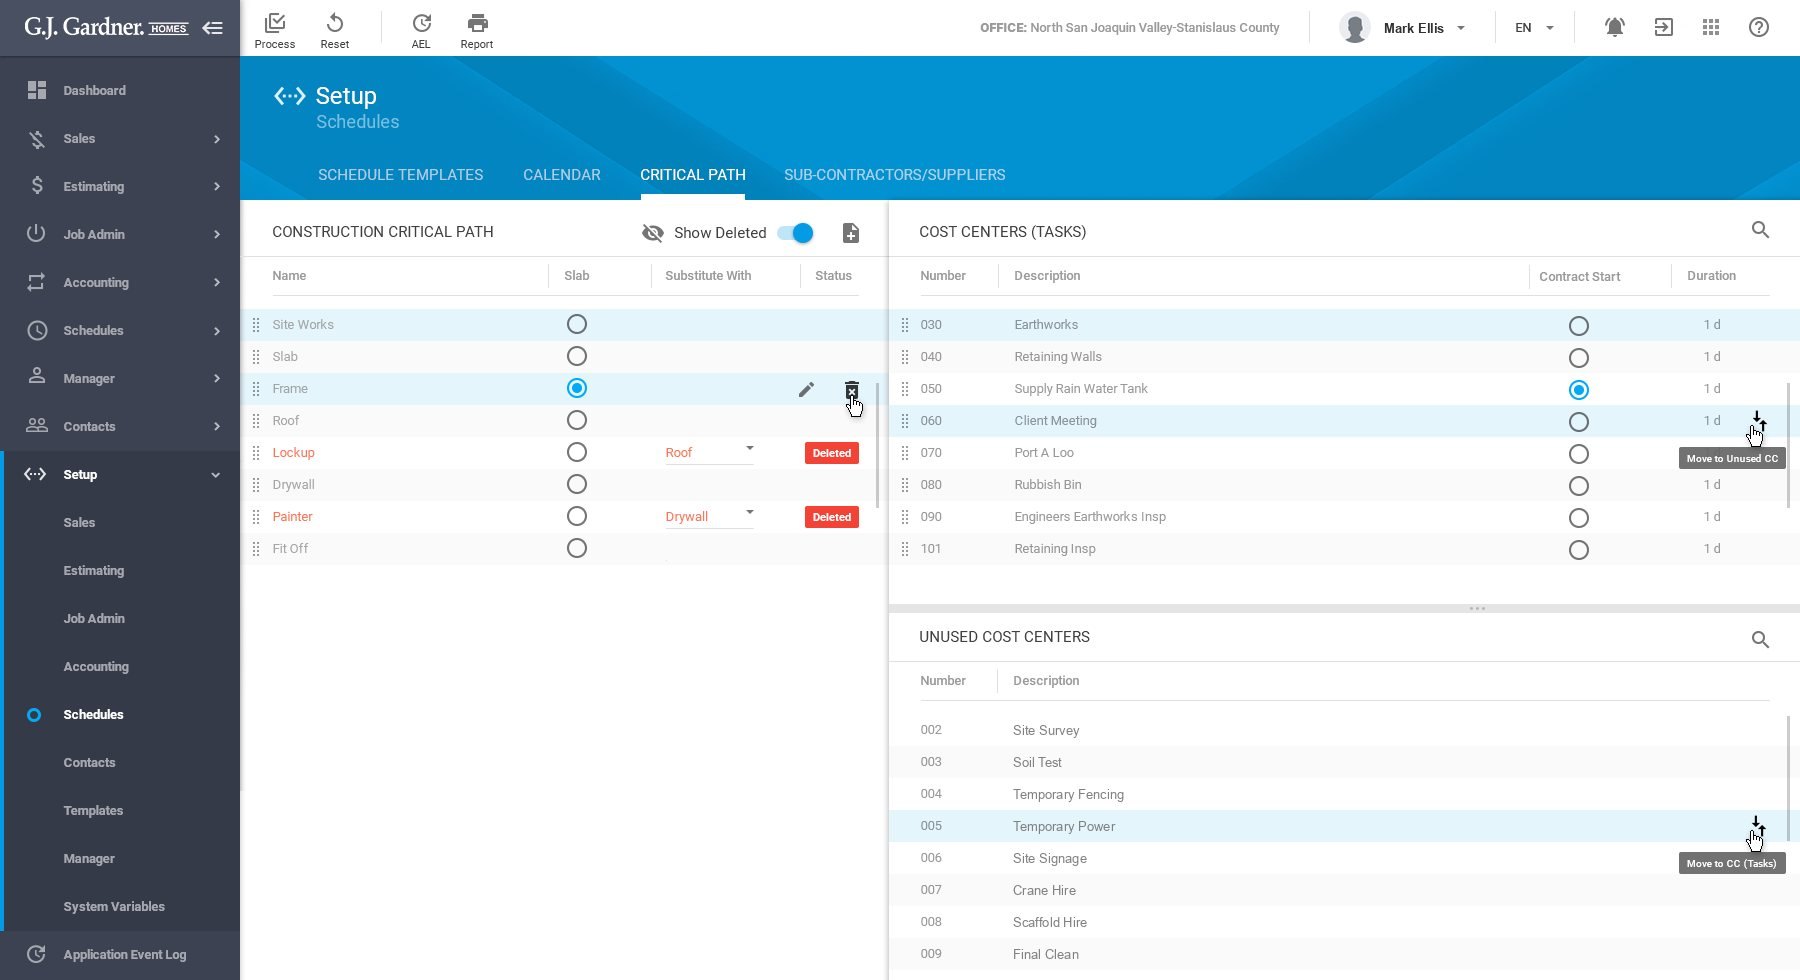
4. Brought interactive prototypes into pre-sales. Instead of selling enterprise projects with slides, I built clickable prototypes used inside sales conversations, so clients could walk through the product before signing. It shortened the distance between "we think you need this" and a signed contract — and Softeq adopted it company-wide as a pre-sales standard.
The solution
A cloud platform that kept the full scope of the legacy system and extended it: a Builder Portal for franchisees, and Supplier and Customer portals adapted for mobile. Accounting syncs with Xero, documents live in G Suite and are signed through EverSign, reports come from 80 templates, and a graphical take-off tool measures material quantities straight from the plan. By the client's account, training new staff and new franchises took about six months on the legacy system and under two on the rebuilt one. The pre-sales prototyping method outlived the project: it became a company-wide standard at Softeq and was used on later enterprise deals.
What I’d do differently
Three years as the sole designer on a system this size was too long to stay solo. I held the whole model in my head, which made me fast and made the project fragile — onboarding anyone new meant transferring years of undocumented decisions. I should have pushed to build a second designer into the project by year two, not because the workload demanded it, but because a system that only one person understands is a risk to the client, not just to me.
Fig. 03 — The estimate screen, 2026 concept
Interactive
What changed against the shipped screen, and why
01
The formula sits next to the line
Was
The quantity formula lived in a tab at the bottom of the screen, beside Cutting list and Memo.
Now
Selecting a line opens its formula and the computed quantity beside it.
Why
The formula explains the number. It should be read with the line, not looked up.
02
A parameter shows its reach
Was
Take-off parameters were a table of code, value and a usage count. The items behind the count opened in a popup.
Now
Each parameter says how many items and cost centres it re-prices, and the edit is visible before the estimate is processed.
Why
One edit can move the whole estimate. The estimator should see how far it goes first.
03
One source label per line
Was
Three columns of dots, Cmp, Fml and Cut, showed where a quantity came from.
Now
One label per line: Price book, Formula or Cutting list. The filters use the same three words.
Why
Three mostly empty columns took the width the numbers needed.